Supply Monitor v1.0: Help and guidance documentation
While we will do our best to update this documentation in a timely manner, some parts may become out of date as our software evolves. Please send an email to support@rovjok.com if you identify any errors, or would like one of our staff to provide assistance.
Table of Contents
- 1. Sign-up and Login
- 2. Application Walkthrough
- 3. Data Assumptions and Methodologies
- Issues and Gaps
1. Sign-up and Login
To access the application, sign-up is currently only available via LinkedIn authentication. Future updates will include email and Office 365 authentication options. Please refer to our Terms and Conditions and Privacy Policy for more details.

2. Application Walkthrough
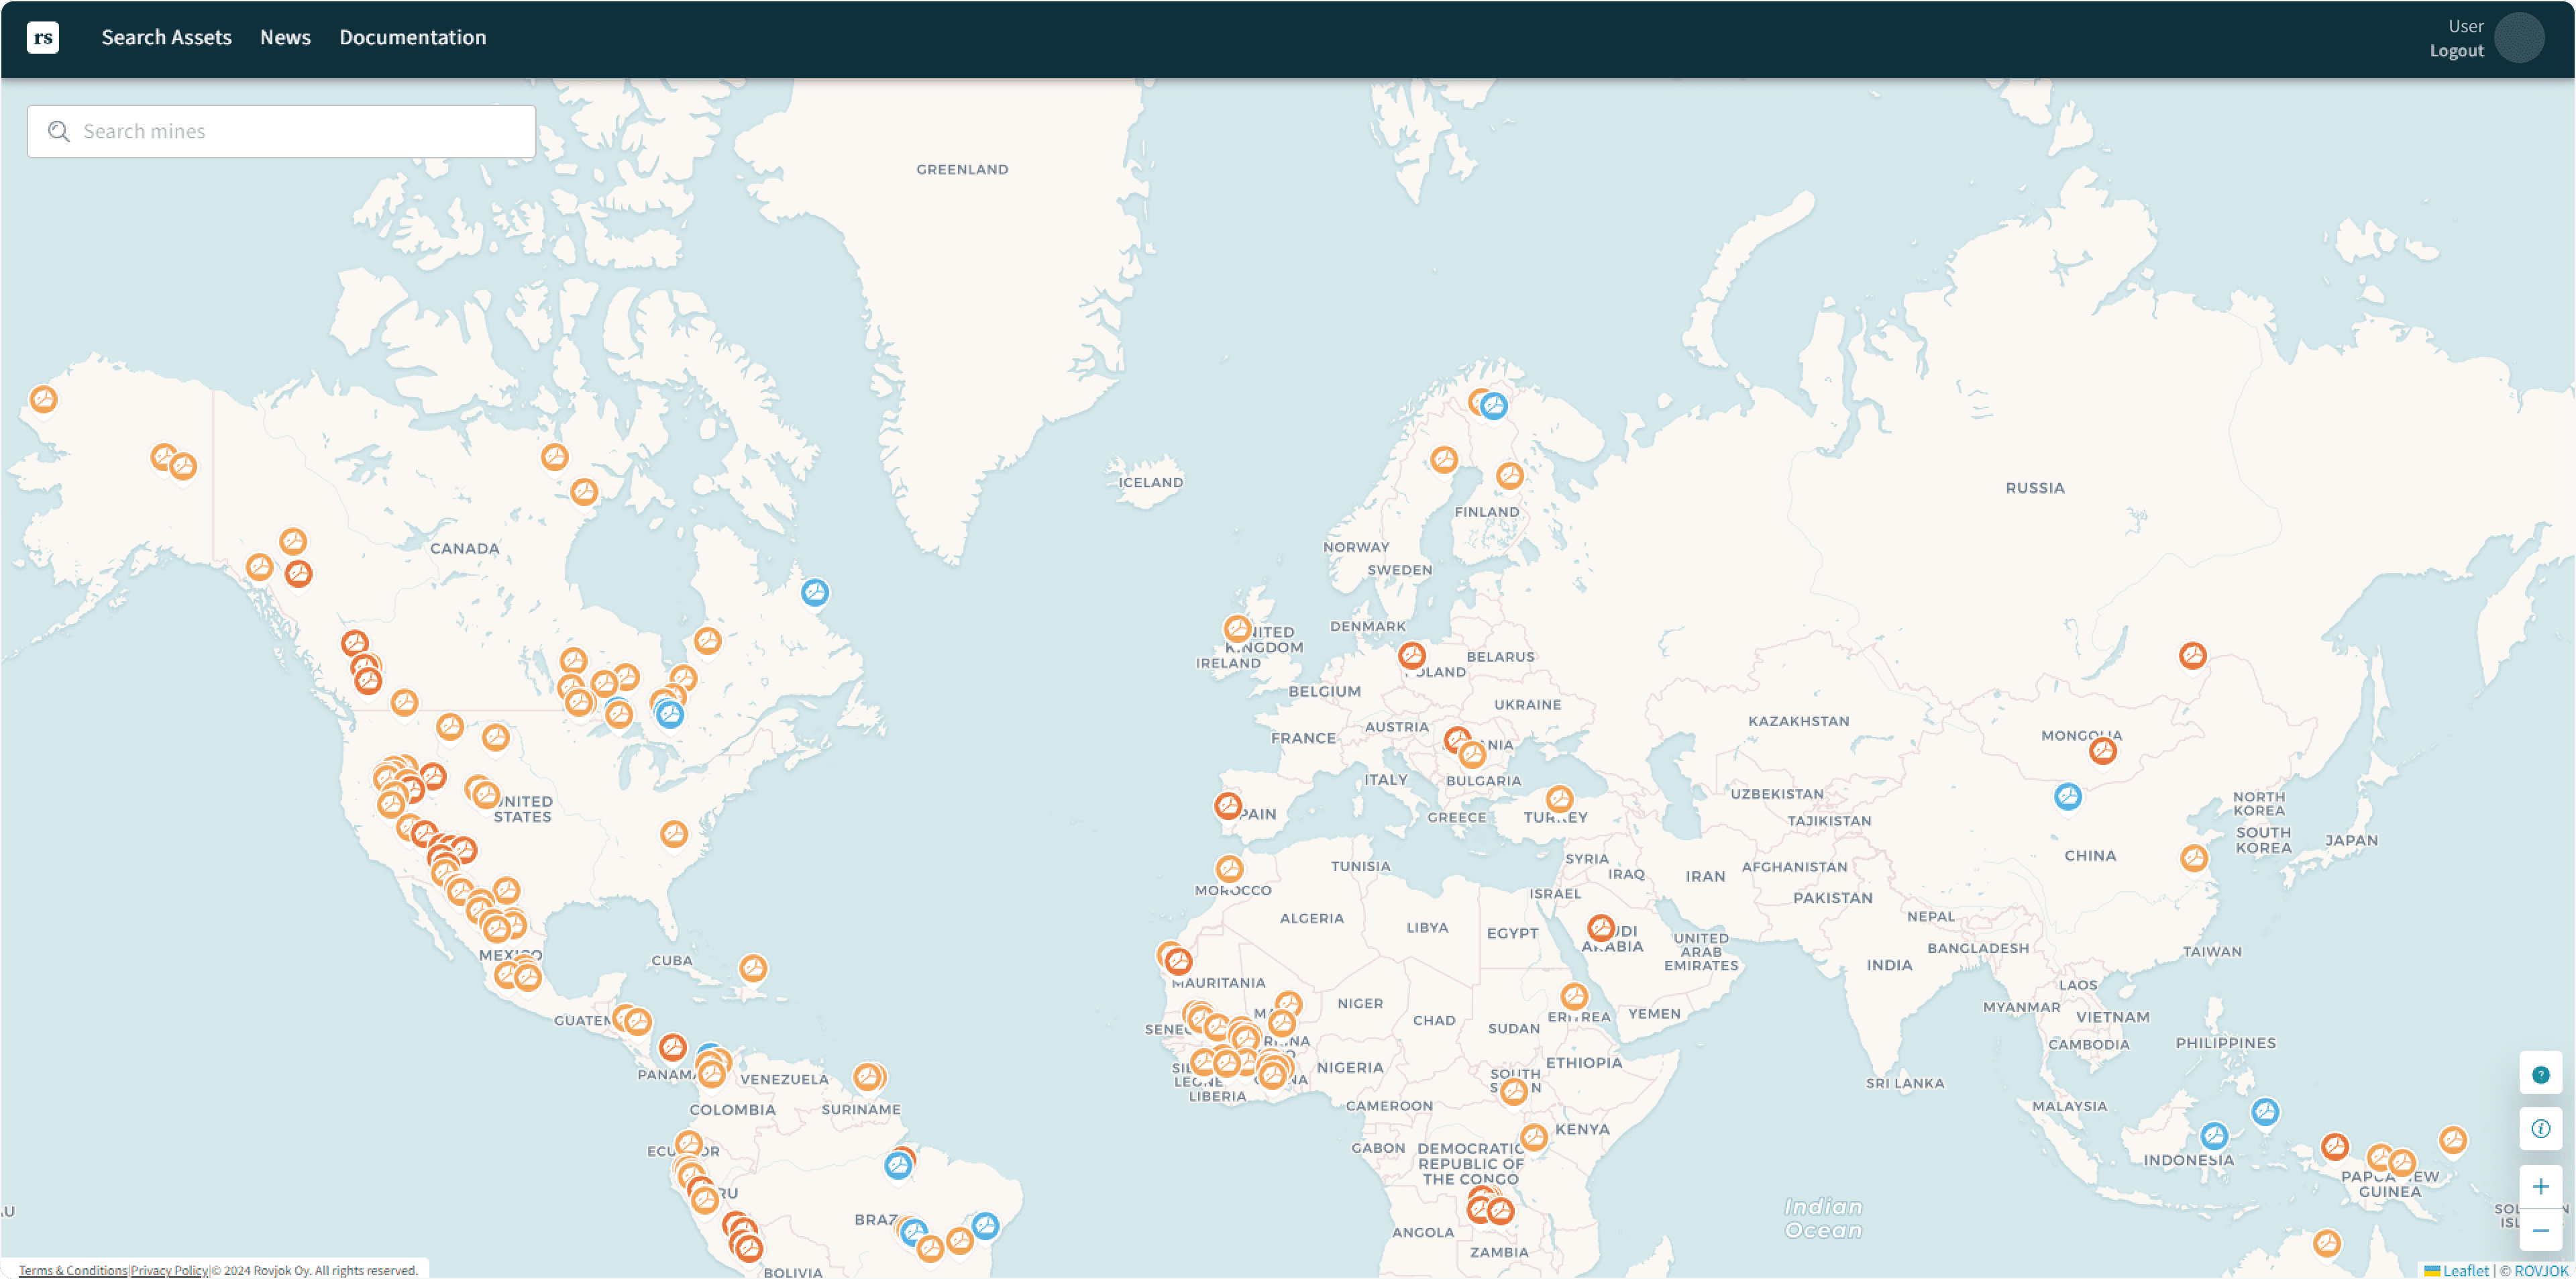
2.1 Home Page: The “Search Assets” Map View
Upon first login, you will see a map displaying mining assets.
- Icons: Represent different types of mining assets. More details on icons can be found here.
- Zoom Options: Located at the bottom right corner, alongside an information symbol to access the legend.
- Search Button: Available at the top left corner. More details here.
- News Tab: Located in the top menu, allowing you to search for mining and metals relevant news. More details here.
2.1.1 Legend
- Copper Mines
- Other Mines
- Nickel Mines
- Supply View or Product View toggle
- Zoom Buttons
 |
Legend |
| Copper Mines | |
| Other Mines | |
| Nickel Mines | |
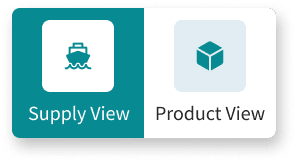 |
Select “Supply View” or “Product View” |
 |
Zoom buttons |
2.1.2 Search Bar
Currently, the search bar allows you to search for a mining asset. Future updates will extend this feature to include searching for commodities and HS Codes.

2.2 Asset Information
You can select a mine asset either by clicking on one of the icons on the map or using the search bar.
When a mining asset is selected, the following information is displayed:
- Asset Information Card: Details about the selected asset (see section 2.2.1).
- Ports and Shipping Routes: Shows goods supplied to or shipped by the mine based on the selected view (Supply View or Product View). More details on interpreting this data can be found in sections 2.2.3 and 2.2.2.3.

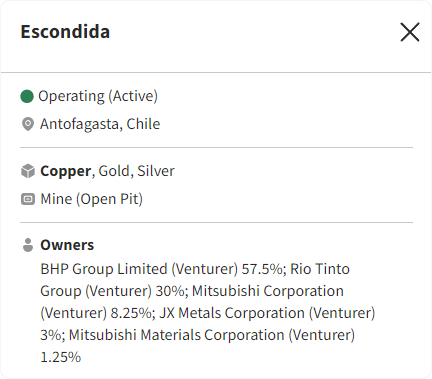
2.2.1 Asset Information Highlights Card
When a mining asset is selected, the Asset Information Card displays to the left of the screen, showing key information:
- Key asset information (i.e., mine operating status, location, owner, type of asset, primary commodity)
- Impact of mine disruption per day (calculated from total production tonnages)
- Related news, tagged to that asset
- Sample commodities (i.e., goods) received by that asset, as determined by shipment trade data
- Sample suppliers that have supplied goods to that asset, as determined by shipment trade data
2.2.1.1 Asset Information
Displays key information about the mine asset, including:
- Operating Status
- Location
- Metals Produced
- Owners
2.2.1.2 Impact of Disruption
Daily equivalent impact of disruption is calculated to provide a proxy for potential impact. For example, Escondida reported 2023 copper production of 878 kt, or 2,407t per day, with metal price assumptions taken from commodity estimates.

2.2.1.3 Related News
We scrape news from various API’s and then apply tags to this news according to:
- Mining asset.
- Port.
- Supply chain relevance.
The full article can be accessed by selecting “Read More”. This then provides a link to the original article, in addition to a numerical sentiment numerical sentiment score between -5 and 5 and made in the context of supply chain issues (where -5 represents a very bad potential supply chain issue and 5 representing a very positive supply chain outlook).

2.2.1.4 Sample Commodities
The commodities card shows top commodities supplied to a given asset, by largest total value. Note that these commodities are not necessarily the top value items supplied to the mine, but instead just the top within the data available from shipping records. Specifically, it is determined from shipping bill of lading data, which covers only those goods received by ship. In addition there are gaps in this data, as not every country reports bill of lading data (see here for data gaps, including a list of countries that are covered by the data).

H.S. Code Unit Price Data:
It then displays three cards that showing unit prices changes for each six-digit H.S. Code, specifically for each commodity showing:
- A card showing month on month change in unit price of that commodity (in percent).
- A card showing the current unit price of that commodity (in USD).
- A graph that shows how the price of that commodity has changed in the last 12 months (percent change from 12 months prior).
See here for more information on data sources and methodology.
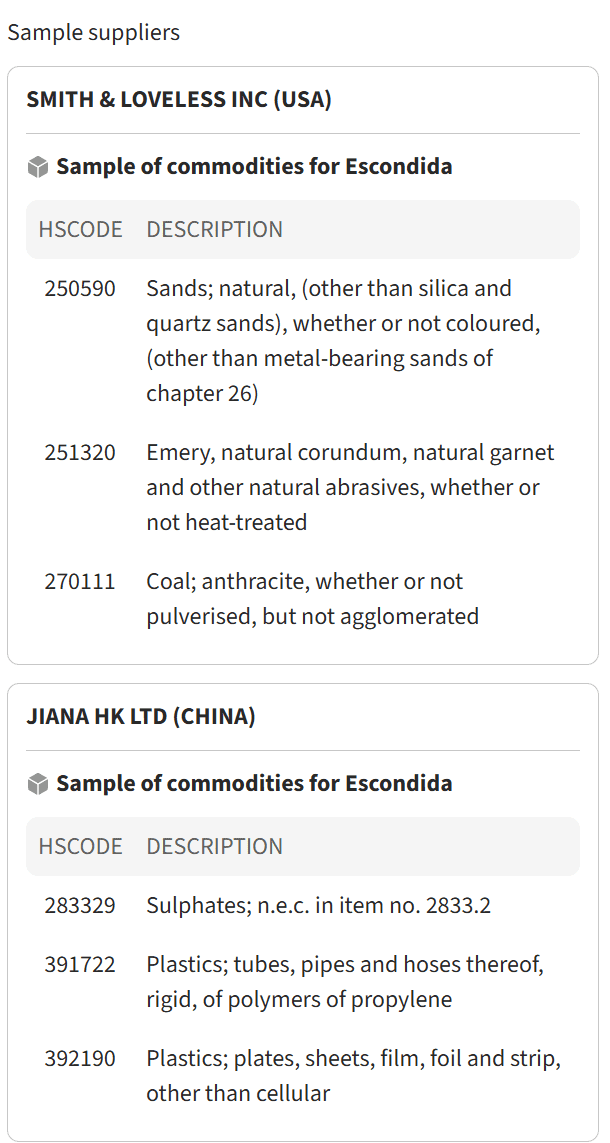
2.2.1.5 Sample Suppliers
The Sample Suppliers part of the Asset Information Card provides an example of the suppliers that have been detected to have been providing goods to that mining asset; and the top goods by value in USD that they’ve been supplying to the six digit H.S. Code level
2.2.2 Asset Shipments Map
When an asset is selected, you will then the Inbound and Outbound ports appear, that represent those ports that have recorded shipping transactions from them which have supplied or received goods from the mine (depending on whether Supplier View or Product View is selected, respectively).
The lines on the page represent the movements of goods, based on Inbound and Outbound ports listed in shipment information.

2.2.2.1 Iconology
Icons on the map represent different aspects of shipping routes and ports.
| Estimated cargo shipment routes | |
 |
Inbound Port |
 |
Outbound Port |
 |
Inbound and outbound port |
 |
Selected asset |
|
Shipment in or out of mine selector (Supply View versus Product view respectively) |
2.2.2.2 Inbound/Outbound Ports
The Inbound and Outbound Ports represent the shipment departure and arrival ports, as per global shipping and trade information. These have been matched to an asset via customised matching/linking between the asset ownership company information and/or dedicated ports affiliated with that asset.
2.2.2.3 Shipping Routes (Estimated)
The shipping routes shown are a representation of the route based on the Inbound and Outbound port, based on the shortest maritime route calculated between ports (see here for information on how this is calculated).
2.2.2.4 Port Shipment Information Card
When a port is selected, a card appears showing:
- Key port information including port congestion and number of vessels waiting
- Top suppliers supplying goods to the mine asset from the port
- Top commodities supplied to the asset from the port
Please note that some countries do not report information on individual suppliers/shippers. In this case, we are only able to report of which country it has been shipped from, i.e. “Supplier from USA.”
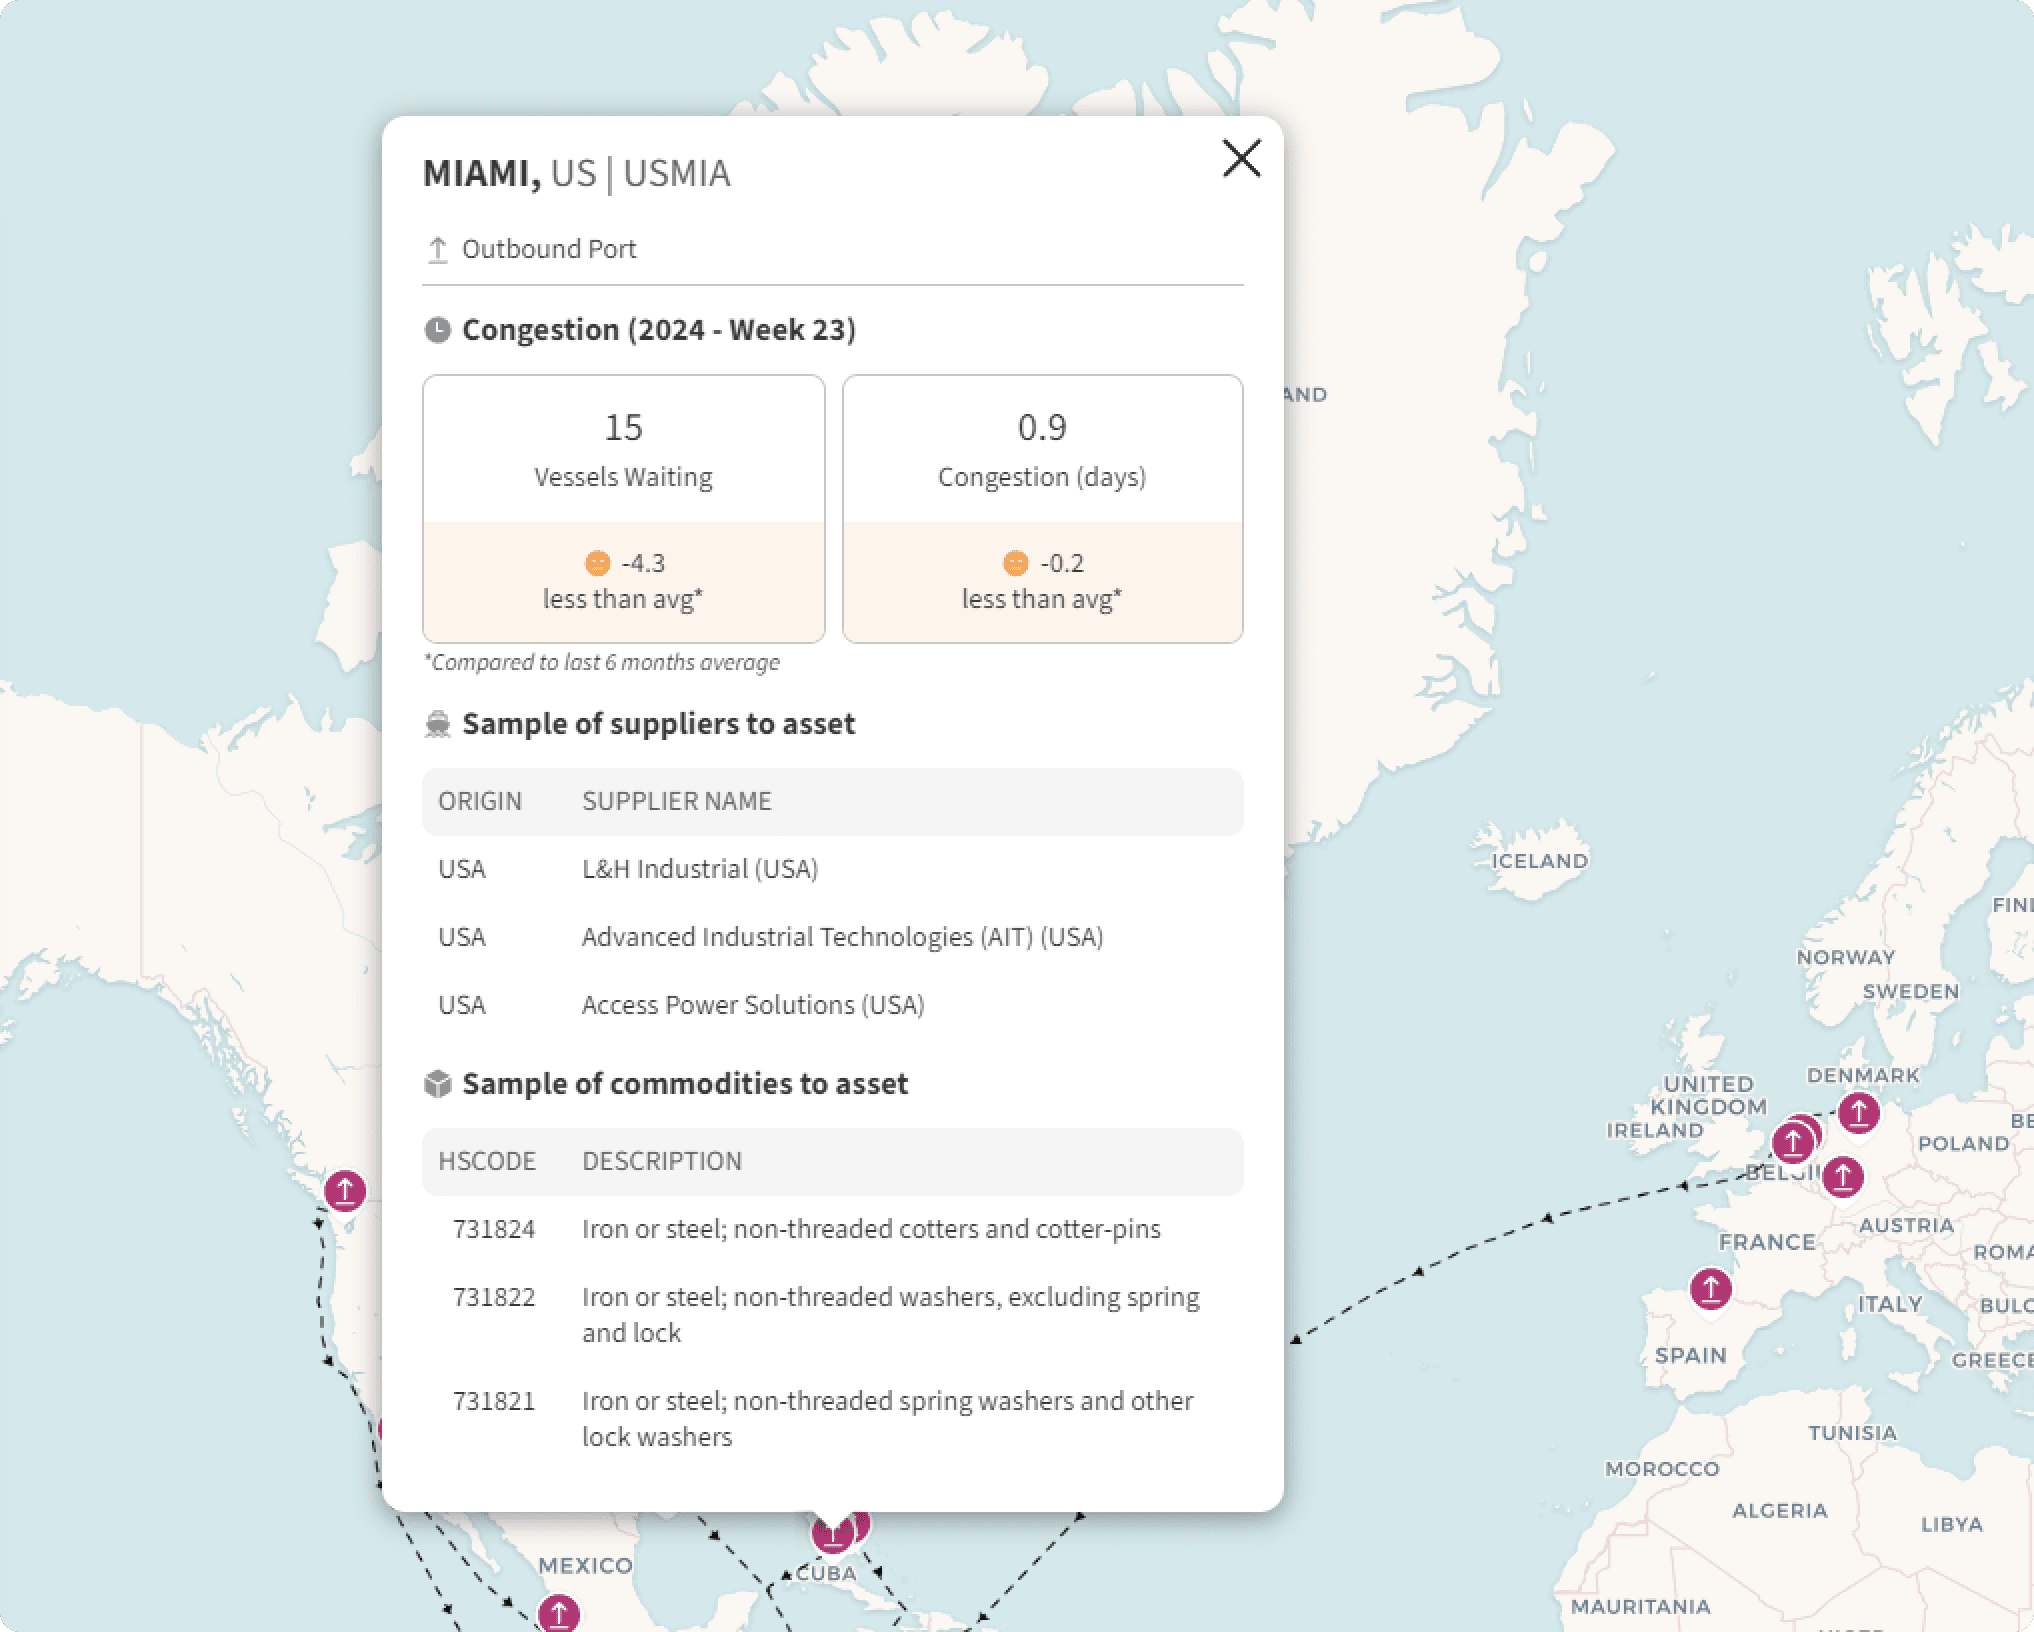
2.2.2.4.1 Congestion
The boxes at the top of the Port Shipment information card show number of vessels waiting and congestion days; to provide a possible indication of risk of shipment delays
2.2.2.4.2 Sample of Suppliers to Asset
The ‘Sample of Suppliers to Asset’ pane shows the top commodities that have been shipped to the selected asset, from the selected port.
2.2.2.4.3 Sample of Commodities to Asset
Shows top commodities shipped to the selected asset from the selected port.
2.2.3 Supply View versus Product View
You can choose to view shipping movements either into or out of the asset.
- Supply View: shows goods shipped into a mine. This may represent shipment into a mine for operating purposes, or for capital expenditure items (e.g. for building a mine or expansion).
- Product View: Shows minerals or metals products shipped out of a mine.
2.3 News
The “Sentiment Score” is also calculated for each news story; using AI based sentiment analysis. This is given in a numerical sentiment score between -5 and 5 and made in the context of supply chain issues (where -5 represents a very bad potential supply chain issue and 5 representing a very positive supply chain outlook). These scores give an indication of possible risk.
*In the future we plan to extend and aggregate these scores to give a clearer and improved contextualised presentation risk.
3. Data Assumptions and Methodologies
3.1 Key Data Assumptions and Limitations
3.1.1 Scope of Data Covered
3.1.1.1 Asset Data
- Data covering mining and metals properties.
- Shows asset names, types, owner information.
- Daily production value at risk data calculated using mine economics models and commodity price forecasts. We multiply the current quarter’s forecast price with the asset’s current year’s forecast payable metal production.
3.1.1.2 Trade Flow Data
- Uses country reported shipping customs and trade data for individual shipment-level details.
- We are able to generate individual trade flows of specific commodities between shippers and consignees, from and to specific ports, and their specific shipment volumes and values.
- Covers around 35% of global trade from various countries (only some countries report this data). The following countries are included within the data:
- Brazil
- Bolivia
- Chile
- Costa Rica
- Colombia
- Ecuador
- India
- Indonesia (up to end of 2021)
- Mexico
- Panama
- Pakistan
- Paraguay
- Peru
- Uruguay
- USA (maritime only)
- Venezuela
- Vietnam
- Where we do not have supplier company information, we supplement with ‘supplier from [goods origin country]’
3.1.1.3 Commodity Price Data
- Calculated statistical bilateral trade data.
- This data covers statistical bilateral trade between over 200 countries, as reported by national statistical agencies.
- There is a differing publication lag for different countries, from several weeks to several months.
- We use the reported values and weights averaged over all reported country exports of a commodity to derive a unit value per 6-digit HS Code.
3.1.1.4 Port Congestion Data
- Sourced from marine traffic apis.
3.1.1.5 News Data
- Uses Bing news API for relevant articles.
3.1.2 Data Quality
3.1.2.1 Known Data Gaps
Identified data gaps and improvement strategies include:
- Country limitations
- Grouped shipment information
- Supplier limitations
- Missing or unmapped (messy) customs data
- Missing mapping
Currently, only tier-1 supplier trade directly into mining assets is shown.
3.1.3 Data Improvement Plans / Roadmap
Plans include increasing commodity coverage and mapping trade flows into in-country suppliers, i.e.
- Increasing commodity coverage by mapping additional assets:
- More nickel
- More lithium
- More copper
- Mapping trade flows into in-country suppliers (e.g. mining explosives services providers like Orica, Exsa, Enaex, Famesa, Maxam, Austin Powder).
3.2 Methodologies
3.2.1 Sample Commodities Methodology
The commodities data is extracted from trade records. These records show item-level shipments of individual commodities (at the 6-digit HS Code level) between suppliers and consignees. They provide additional information including the origin and destination countries, ports, value of goods, and weight of goods. Further information is presented in section 3.1.1.2.
We are currently only able to show suppliers and their top commodities supplied to mining assets from the countries that report trade data, as listed in section 3.1.1.2. In-country suppliers are generally not visible from this data.
Data published by the USA is at a shipment level, so for these shipments containing multiple commodities, the value and weight is only known at the overall shipment level. These shipments are flagged accordingly.
Prices for each commodity are derived from bi-lateral trade data.
3.2.2 Sample Supplier Methodology
From the available trade data linked to a mining asset, we rank by total value of goods (in USD) and show the top three suppliers.
3.2.3 Shipment Routes Methodology
Shipment routes are calculated using the searoute python package. This package creates the shortest maritime routes between ports. It returns a geoJSON route object when given the latitude and longitude of the start and end locations.
For every trade flow where we have a known origin and destination port, we create a route using the searoute package.
3.2.4 Congestion Calculation Methodology
Port congestion data is the median of days at port and anchorage and is reported on a weekly basis. This data is provided by an external commercial provider.
3.2.5 Assigning Mining Assets Methodology
Mining assets are allocated to trade data flows using a semi-automated methodology. The consignee (or shipper for Product Flows) name from the trade data is compared to the asset and/or operator name and matches are allocated to that asset.
From this we create a dataset of trade data entities matched to mining asset names
3.2.6 Assigning Suppliers Methodology
Once trade flows have been matched to assets (section 3.2.5), those trade flows with the mining asset as consignee provide a list of supplier company entities from the ‘shipper’ field. Where a supplier is unknown (the shipper field is blank), we use the origin country as a placeholder, so these show as ‘Supplier from [Country]’.
3.2.7 Assigning Products / Ports Methodology
Each trade flow shows the commodity being shipped at the 6-digit HS Code level (see WCO website). Where we have the origin and destination port information, these trade flows are shown by clicking on the ports. For the ‘Sample Suppliers’ section on the left-hand tab, the top suppliers and commodities from the trade dataset are shown, ranked by value in USD.
